March CPI Preview: How Much Will Gas Prices Push Inflation Higher?
The March 2026 CPI report drops April 10. Economists expect the biggest monthly jump since 2022 as gas prices surge past $4. Here is what to watch.
The March Consumer Price Index lands Friday morning, and economists are bracing for the sharpest monthly inflation spike in nearly four years. The war in Iran, a closed Strait of Hormuz, and gas prices above $4 a gallon are about to show up in the data for the first time. Here is what the numbers are likely to say and what they mean for the Fed, for rates, and for your wallet.
When Does the March CPI Report Come Out?
The Bureau of Labor Statistics will release the Consumer Price Index for March 2026 on Friday, April 10, at 8:30 a.m. Eastern. This is the first inflation report capturing a full month of data since the U.S. and Israel began military operations against Iran on February 27 and Iran subsequently closed the Strait of Hormuz.
February’s CPI, released on March 11, showed a 0.3% monthly increase and 2.4% annual rate. That was the last clean reading before the energy shock hit. March will tell a very different story.
What Are Economists Forecasting?
Wall Street consensus has clustered around a headline CPI jump of 0.9% month over month, which would be the largest single-month increase since June 2022. On a year-over-year basis, headline CPI is expected to leap from 2.4% to somewhere in the 3.2% to 3.5% range.
Bank of America economists project a 0.9% monthly headline increase driven by a 10.6% surge in the energy component. Core CPI, which strips out food and energy, is expected to come in at a more moderate 0.3% month over month, with used car prices rising 1% and core services climbing 0.28%.
The Cleveland Fed’s Inflation Nowcast, updated April 2, projects the 12-month CPI rate hitting 3.25% for March. That model uses daily oil prices, weekly gasoline prices, and monthly inflation readings to generate real-time estimates. It has been one of the more reliable short-term forecasting tools throughout this cycle.
| Metric | February 2026 (Actual) | March 2026 (Consensus) |
|---|---|---|
| Headline CPI (m/m) | 0.3% | 0.9% |
| Headline CPI (y/y) | 2.4% | 3.2% to 3.5% |
| Core CPI (m/m) | 0.2% | 0.3% |
| Core CPI (y/y) | 2.5% | ~2.8% |
| Energy (m/m) | 0.6% | 10.6% |
| Shelter (m/m) | 0.2% | ~0.3% |
| Food (m/m) | 0.4% | ~0.4% |
Why Is Energy the Entire Story?
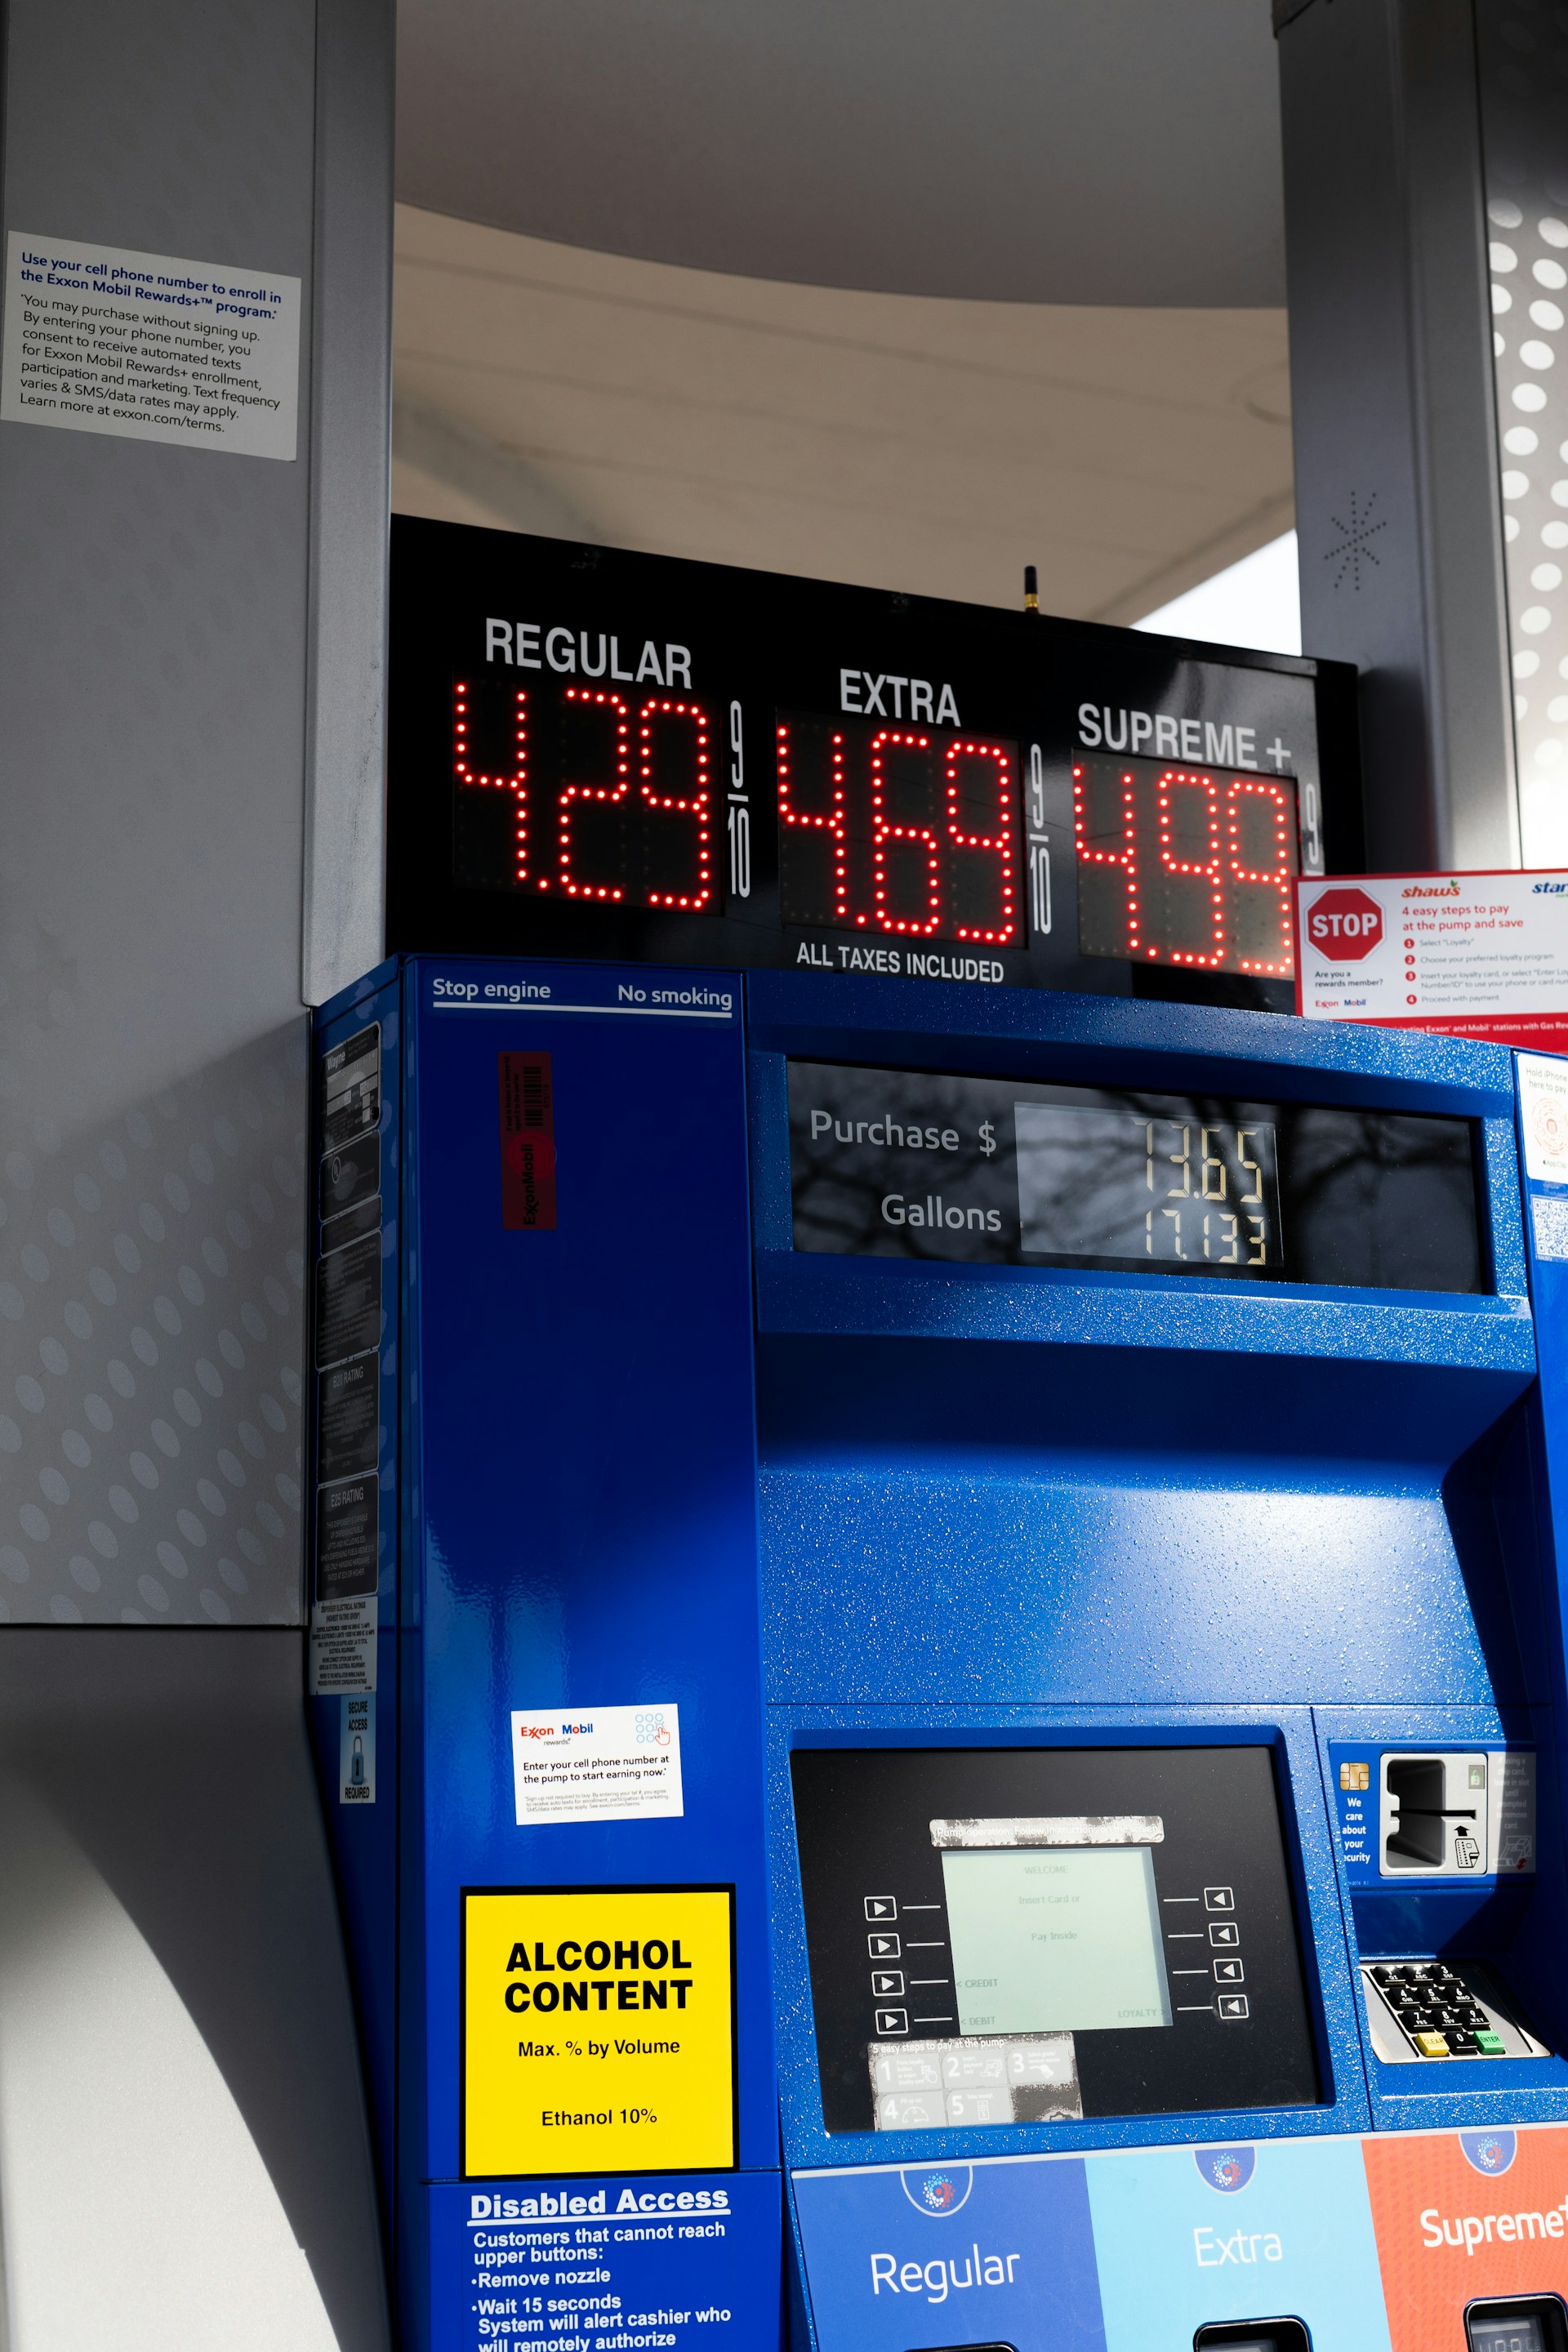
The national average gasoline price has jumped by roughly $1.00 per gallon since the war began. Regular unleaded hit $4.14 as of early April, up from $2.98 on February 26. With WTI crude above $115 and Brent near $110, pump prices have no relief in sight as long as the Strait of Hormuz remains effectively shut.
Gasoline carries a weight of roughly 3% to 5% in the CPI basket, but its volatility gives it an outsized influence on the headline number. Based on March averages alone, gasoline is expected to add about two-thirds of a percentage point to the 12-month headline figure.
The energy shock is also bleeding into services. The ISM Services Prices Paid index showed 17 out of 18 industries reporting higher prices in March, with the steepest hikes in transportation, warehousing, and construction. That is how an oil shock becomes an everything shock.
What Did February’s CPI Look Like Under the Hood?
Before the war upended the picture, February’s inflation report was benign. Here is how the major components broke down, according to the BLS release.
| Component | Monthly Change | 12-Month Change |
|---|---|---|
| All Items | +0.3% | +2.4% |
| All Items Less Food & Energy | +0.2% | +2.5% |
| Shelter | +0.2% | +3.0% |
| Energy | +0.6% | n/a |
| Food | +0.4% | n/a |
| Food at Home | +0.4% | n/a |
| Food Away from Home | +0.3% | n/a |
| Medical Care | n/a | +3.4% |
Shelter inflation at 3.0% year over year was still the stickiest component. But the story was one of gradual cooling. Core CPI at 2.5% annual was the lowest reading since early 2021. That progress is now at risk of being overshadowed by the energy spike.
How Does This Compare to the Inflation Trajectory?
Context matters. Inflation had been steadily declining before the Iran conflict disrupted the trend.
The CPI peaked above 9% in mid-2022. By December 2024, it had fallen to 2.9% year over year. Through 2025, it continued drifting lower, averaging about 2.6% for the year. By February 2026, the 12-month rate sat at 2.4%, tantalizingly close to the Fed’s 2% target.
A March reading of 3.2% or higher would reverse more than a year of disinflationary progress in a single month. That is why this report carries so much weight. The question everyone is asking: is this a temporary energy-driven blip, or the start of a second wave?
Glenmede estimates that the oil price increase alone could add roughly 0.8 percentage points to inflation over the next year. If the Strait of Hormuz reopens and oil retreats, much of that reverses. If it does not, the passthrough into food, shipping, and services could make the inflation bump far more persistent.
What Does This Mean for the Fed and Interest Rates?
The Federal Reserve held the fed funds rate at 3.50% to 3.75% at its March meeting and projected just one rate cut for all of 2026. Chair Powell emphasized patience, and the March CPI report will likely reinforce that stance.
The CME FedWatch Tool currently shows a 94.8% probability that the Fed holds rates unchanged at the April 28 to 29 FOMC meeting. Markets have essentially priced out any near-term easing.
Wall Street banks are adjusting their forecasts accordingly. Citigroup pushed its first rate cut call from June to September after the strong March jobs report, still expecting 75 basis points of total cuts (September, October, December). Wells Fargo went further, dropping rate cut expectations for 2026 entirely, citing the inflation bump and geopolitical uncertainty.
The 10-year Treasury yield near 4.34% to 4.37% reflects this repricing. Bond investors are demanding higher compensation for the risk that inflation stays elevated longer than previously expected.
Is This Inflation Spike Temporary?
That is the trillion-dollar question. The answer depends almost entirely on oil.
If the Iran conflict de-escalates and the Strait of Hormuz reopens in coming weeks, energy prices should fall sharply, and the inflation spike would wash out of the data within two to three months. The core CPI trend, which remains closer to 2.5% to 2.8%, would reassert itself, and the Fed could resume its path toward eventual rate cuts.
If the conflict drags on and oil stays above $100, the picture changes. Higher transportation costs feed into food prices. Jet fuel lifts airfares. Diesel boosts shipping costs for everything from lumber to electronics. The University of Michigan consumer survey already shows 12-month inflation expectations at 3.8% in the final March reading, up from 3.4% in February. Once expectations become unanchored, the Fed’s job gets much harder.
What Should Investors Watch on Friday?
Three numbers matter most when the report drops at 8:30 a.m.
Headline CPI month over month. Anything above 1.0% would shock markets. A reading between 0.7% and 0.9% is priced in. Below 0.7% would be a relief rally catalyst.
Core CPI month over month. This is where the Fed’s attention stays. A 0.3% print keeps the door open for rate cuts later this year. Anything at 0.4% or above signals that inflation pressures are spreading beyond energy, and that would likely push Treasury yields higher and stocks lower.
Shelter. The biggest line item in the CPI basket. If shelter inflation continues its slow decline from 3.0% annual, it offsets some of the energy damage. If it reaccelerates, the Fed has a much bigger problem.
For investors with diversified portfolios, this report is a data point, not a directive. Short-term inflation readings driven by geopolitical supply shocks tend to be noisy. The underlying trend in core inflation, labor costs, and shelter still matters more for the medium-term rate path. If you are unsure how inflation affects your long-term purchasing power, we wrote about that dynamic in detail here.
The broader question, whether the disinflationary trend that held for most of 2024 and 2025 can survive an energy shock, will not be answered by a single CPI print. But Friday’s number will set the tone for markets, for the Fed, and for policy debates through the summer. If you have not reviewed your asset allocation in light of this new inflation regime, now is a reasonable time to do so.
Ferrante Capital LLC is a registered investment adviser in Virginia Beach, VA. Information presented is for educational purposes only and does not constitute investment advice. Past performance is not indicative of future results. Economic data and market figures cited reflect information available as of April 7, 2026, and are subject to change. Forward-looking statements reflect the views of the author at the time of writing and may not materialize. Readers should consult a qualified financial professional before making investment decisions.
Ferrante Capital LLC is a registered investment adviser. Information presented is for educational purposes only and does not constitute investment advice, a solicitation, or a recommendation to buy or sell any security. All investing involves risk, including the possible loss of principal.
FC and its principals may hold positions in securities or asset classes discussed in this article. This analysis is for educational purposes only and does not constitute a recommendation to buy, sell, or hold any security.
Forward-looking statements reflect Ferrante Capital’s current analysis and involve assumptions and estimates. Actual results may differ materially. Past performance is not indicative of future results.
Please consult a qualified financial professional before making investment decisions.


